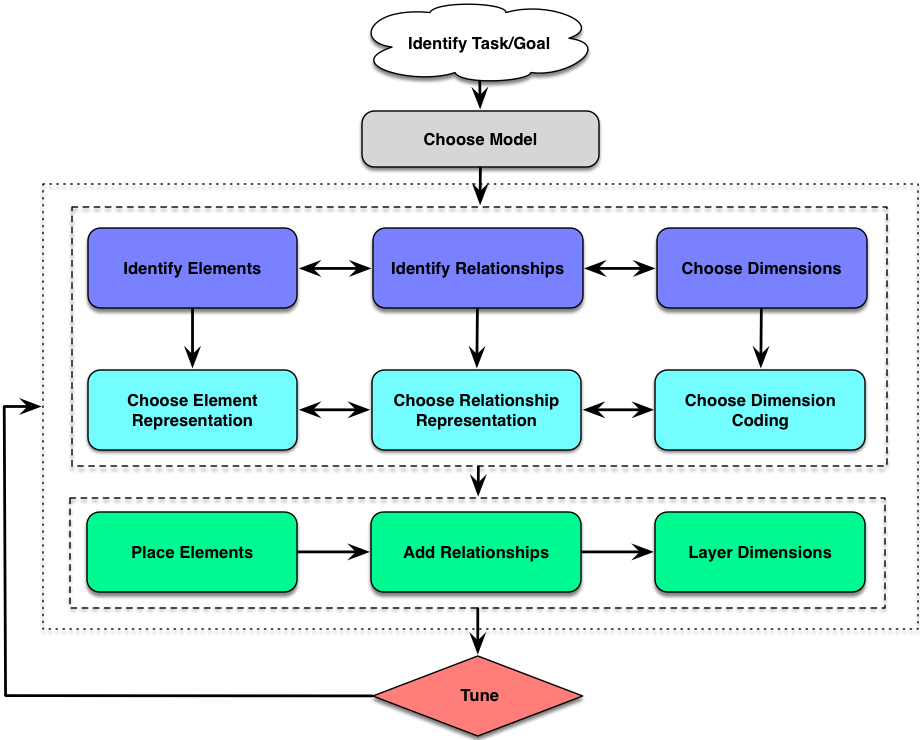
So yesterday I talked about the value of diagrams, but I thought I’d add a bit about the process of actually creating diagrams. Naturally, I created a diagram about it.
 I created this diagram for a session I ran on diagramming a number of years ago. In that session I talked about our cognitive architecture, why we need models, how diagrams work, properties and design issues, and more. At the end, I proposed a potential process for it. It captures an ideal picture of how diagramming could work.
So, you need to know the elements of the model you want to relate, identify the relationships, and any dimensions that characterize differences between the elements. Then you have to choose how you’re going to represent them: shape, color, weight, font, and more.
With your elements, you can then place them, connect them, and add the visual coding. Then, of course, you tune.
This is an ideal process, but in reality it’s much more flexible, at least when I’m creating a model as a way of understanding. I typically iterate, creating placeholder elements, and moving them around until I think I have the right ones. Then I go about connecting them to make sure I have the relationships right. Then I work on adding dimensions, and colors, and aligning them, and grouping them, and… Except that I might add some elements, then group, or connect, then add more, and… it’s a very iterative process. It’s a creative process that involves lots of experimentation, revision, and more.
Sometimes, I even use a diagram and then realize it’s not working and revise it. So, for instance, I blogged about a representation of social process. I got some feedback that it wasn’t very clear. So, I made a second stab at it, and I think it worked better. Certainly, I continue to use it without complaints.
And I’m the first to admit that my diagrams may not look as good as the ones that professional graphic designers could create, but they’re good enough (and OmniGraffle does a good job of making it easy for me to make them up to a standard I think is at least acceptable and useful; it’s probably overkill but I’ve stuck with it for years now). And that’s the point. If they help you think better, it’s good enough. If it helps you communicate effectively with someone else, even better. Diagrams are cognitive tools, offloading conceptual complexity to graphic relationships and visual processing. And with the complex problems we increasingly face, I reckon the more tools the better.
Leave a Reply